
Lesson 1 — Quantifying Value and Return
Unit 5 | Lesson 1 of 2
By the end of this lesson, you will be able to:
- Distinguish between direct and indirect productivity value and explain why both matter to senior decision-makers (K5, S14)
- Produce a credible quantified value estimate for your chosen automation opportunity (S14)
- Use the Effort/Value matrix as a first prioritisation step to select the strongest candidate from a shortlist (S14)
- Calculate a rough ROI and payback period, using your value estimate and an approximate cost, to test whether an opportunity is worth pursuing (K13, S15)
- Use an AI assistant to stress-test your value and return reasoning and surface assumptions you may have missed (S14, B4)
From analysis to argument
In Unit 3, you did the diagnostic work: candidate processes identified, scored across five dimensions, current-state workflow mapped. Unit 5 asks a different question — not "is this automatable?" but "is this worth doing, and can you prove it?"
That is a meaningful shift. Suitability assessed technical and organisational feasibility; value asks a commercial question — what does success actually deliver? A process can score highly on every suitability dimension and still not be worth automating if the value it creates is negligible, hard to measure, or invisible to the people approving it. Equally, feasibility challenges can be worth resolving if the value unlocked justifies the investment.
Your business case needs to make that argument. This lesson gives you the tools.
Direct and indirect value
Productivity value from automation comes in two forms, and the distinction matters because senior decision-makers weight them differently.
Direct value is measurable and immediate: hours saved, errors avoided, transaction volume processed without manual intervention, capacity released for redeployment. Lead with this — it is the easiest to verify and hardest to dismiss.
Indirect value is real but harder to quantify: better user or customer experience, reduced staff frustration, data quality improvements with downstream effects on decisions, and strategic positioning — being seen to use AI effectively. Senior leaders often weight it as heavily as direct value, particularly when deciding whether a pilot is worth scaling.
Neither type outranks the other. A strong business case acknowledges both, and is honest about which estimates are precise and which are directional.
💬 Reflection
Think about your chosen process. If automated successfully, who benefits, and how? The obvious answer is whoever does the task manually — but who else receives the output, makes decisions from it, or chases updates because it runs slowly? Each is a potential indirect value claim.
How to build a credible value estimate
The key word in "value estimate" is estimate — not a financial model accurate to four decimal places, but a credible, reasoned approximation a sensible person could follow and challenge.
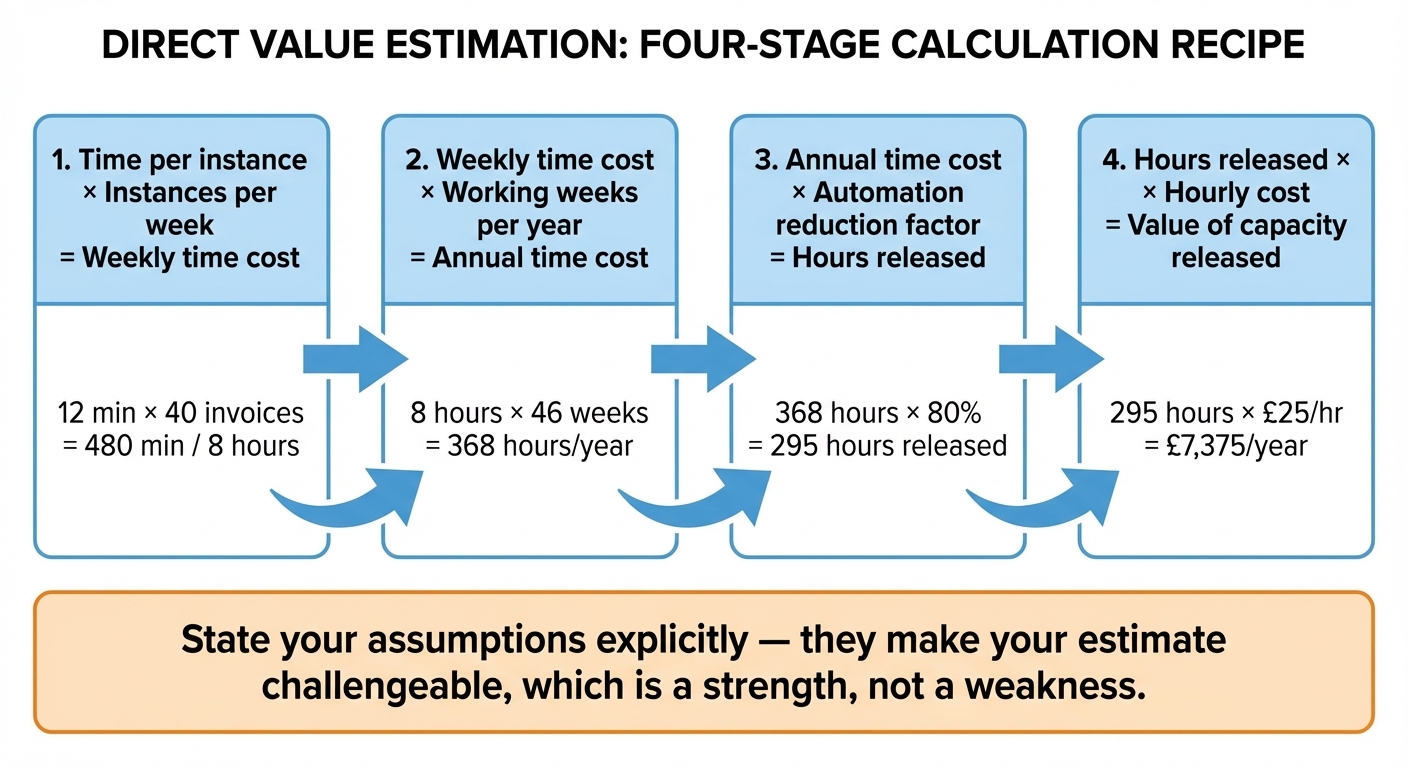
The structure: how long does one instance take, how many occur per week or month, how many people are involved? Multiply for total current time investment, apply a realistic reduction factor — the proportion automation could plausibly absorb — to get released capacity, then convert to hours per year and, if relevant, to a cost using an average salary for the role.
A worked example: manually extracting data from around 40 supplier invoices a week, 12 minutes each, is 480 minutes — 8 hours — weekly for one finance team member, or roughly 368 hours over a 46-week year. An automated pipeline handling 80% of invoices releases around 295 hours a year. At £25/hour all-in, that's roughly £7,400 of capacity released annually — not saved, but available for redeployment to higher-value work.
What makes this credible: round figures throughout, the 80% assumption stated explicitly, capacity released rather than money saved (more honest), and enough specificity that a line manager would recognise the process and judge whether the numbers feel right.
Accounting for the full cost: Total Cost of Ownership
A value estimate is only half a business case: what matters is what the automation is worth net of what it costs to build and run. Otherwise well-argued cases fall down here — benefit quantified carefully, then a single optimistic cost figure attached (usually just the tool or licence price), ignoring what else the organisation will spend to get and keep that benefit.
Total cost of ownership (TCO) costs the whole lifecycle, not just the sticker price. The headline number — a subscription fee, per-request API cost, or build estimate — is usually the smallest of three layers.
Build and integration: connecting the automation to the source data, the people who do the task, their existing tools, and any approval or exception step. Rarely trivial, and usually the dominant cost — often several times the price of the tool itself. A quote showing only the licence fee signals integration hasn't been thought through.
Ongoing operation and maintenance: monitoring, periodic review, and someone accountable when it breaks. A recurring cost teams often forget — they cost the build, never the run, then find six months later that nobody owns the thing.
Change management and hidden cost: training, shifting roles, running old and new in parallel while trust is established, plus a residual manual layer for exceptions automation can't handle — none of it shows up in a vendor quote, but all of it is real spend.
Set alongside the value estimated earlier, these three layers give a far more honest picture: an easy win on value alone can look different once integration and oversight are added, and an expensive-looking process can still be worth it if released capacity is large enough to absorb that cost over time.
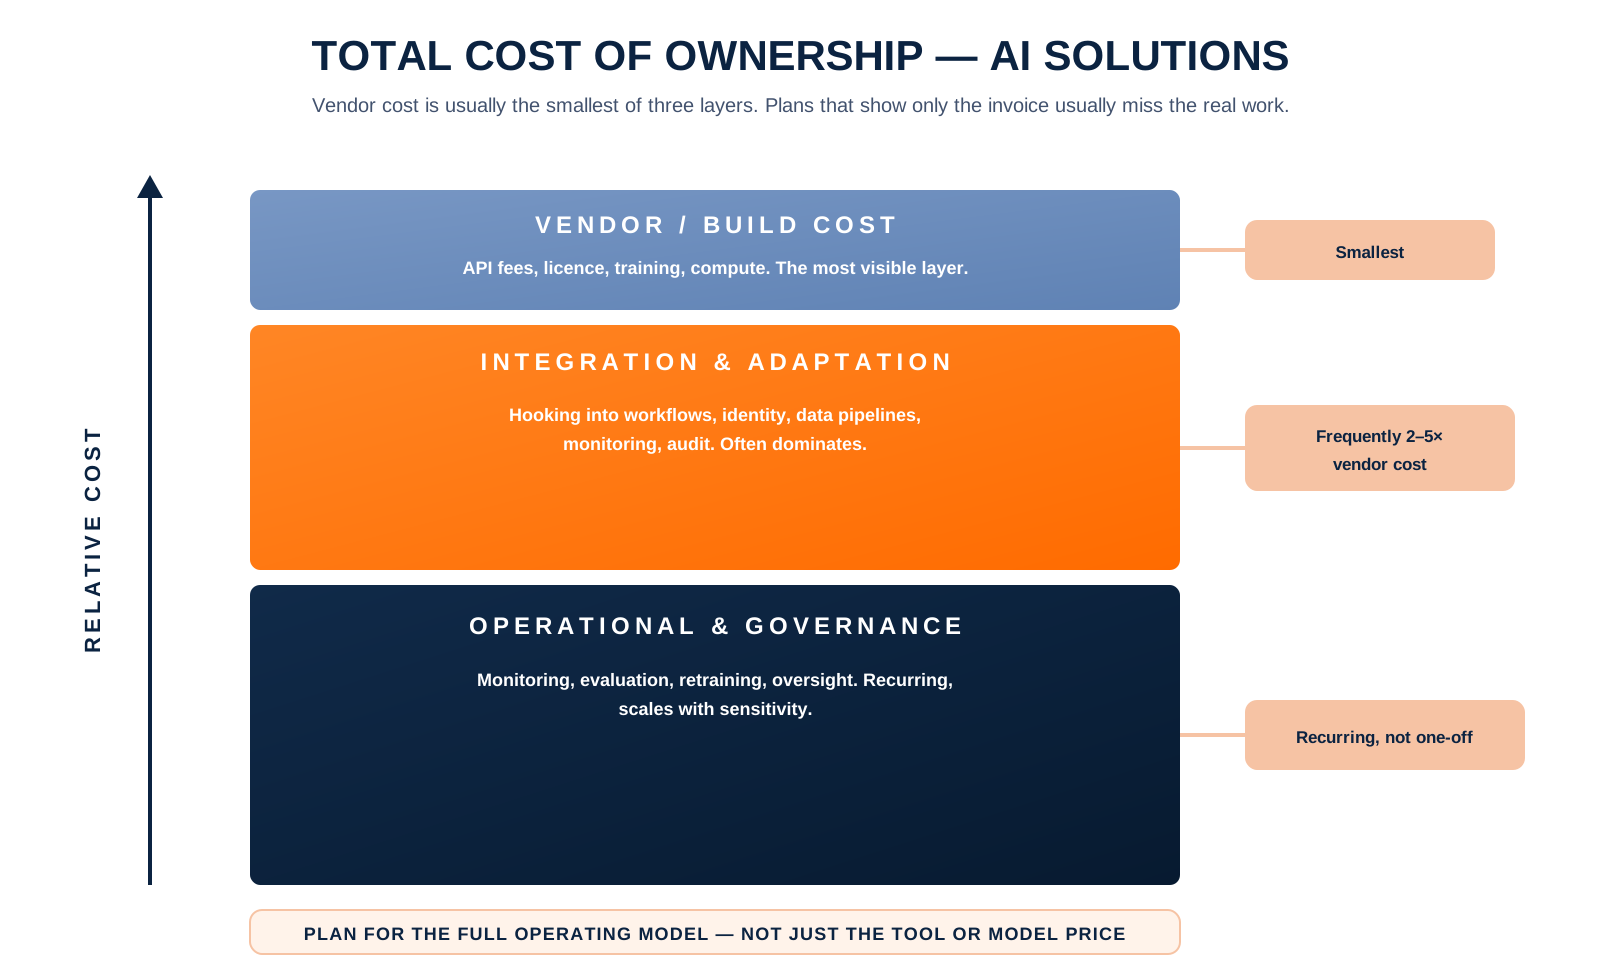
The goal at this stage isn't a full financial appraisal — that comes later. It's simply to ensure your value estimate sits alongside a realistic view of what the automation costs to build, run, and embed, rather than being compared against nothing.
Compare indicative benefits with indicative costs
At this stage, the purpose of costing is opportunity selection, not formal financial appraisal. Put the annual direct-value estimate and the important indirect benefits beside a rough view of the costs to build, run, and embed the automation. Use the same scope and time period, label each figure as evidence-based or assumed, and keep ranges where a single number would imply false precision.
For the invoice-processing example, the indicative annual benefit is about £7,400 of released capacity. Suppose an early conversation suggests £8,000–£15,000 to build and integrate, plus £2,000–£4,000 each year for operation, oversight, and change support. That is enough to challenge whether this is genuinely the strongest opportunity and to identify which assumptions need investigation. It is not enough to approve a solution or commit a budget.
A simple comparison should therefore answer four questions:
- What direct and indirect benefits might the opportunity create?
- Which whole-life cost categories are likely to matter?
- Does the scale of indicative benefit appear proportionate to the indicative cost?
- Which uncertain assumption could most easily change the priority?
Record the answer as a range and a judgement, such as: "The opportunity remains promising if integration can be kept near the lower half of the estimate and the released capacity is redeployed; both assumptions need validation." Module 2 will turn this first-pass comparison into a whole-life budget, ROI model, scenario analysis, and formal financial evaluation. Preserve your figures and assumptions so that work extends this estimate rather than starting again.
Validating and stress-testing your estimate with AI
Once you have a value estimate, ask an AI assistant to pressure-test it — not to produce the estimate (the numbers must come from your own organisational knowledge), but to challenge the reasoning, surface unstated assumptions, and suggest value dimensions you may have overlooked.
A useful prompt: "I have produced a value estimate for an automation opportunity at my organisation. Here is my reasoning: [paste your estimate]. Can you identify any assumptions I have made that are not explicitly stated, any value dimensions I may have missed, and any ways this estimate could be challenged by a sceptical senior stakeholder?"
Not every challenge will land, since the AI doesn't know your organisation — but the relevant ones matter. Common gaps it surfaces: ignoring the time cost of exceptions (the 20% not automated still need handling); conflating capacity released with headcount reduced (the first is almost always achievable, the second rarely is); and failing to quantify indirect value the direct estimate makes invisible.
Used this way — as critical thinking partner rather than answer generator — AI makes your business case stronger for having been challenged before you submit it.
The Effort/Value matrix: a first prioritisation step
If you have more than one strong candidate from Unit 3 — or want a more rigorous case for the one you chose — the Effort/Value matrix is the tool for that comparison.
It plots candidates on two axes: value (a composite of estimated direct and indirect value, scored High, Medium, or Low relative to the others) against effort (a composite of technical complexity, data readiness, and organisational friction from your suitability scoring, scored the same way).
Each quadrant has a clear implication. High-value, low-effort processes are your priority — start here, build confidence, demonstrate results. High-value, high-effort ones are worth pursuing but need more preparation first. Low-value, low-effort processes aren't priorities — fine as training exercises, but not worth your apprenticeship slot. Low-value, high-effort ones should be set aside regardless of how interesting they seem.
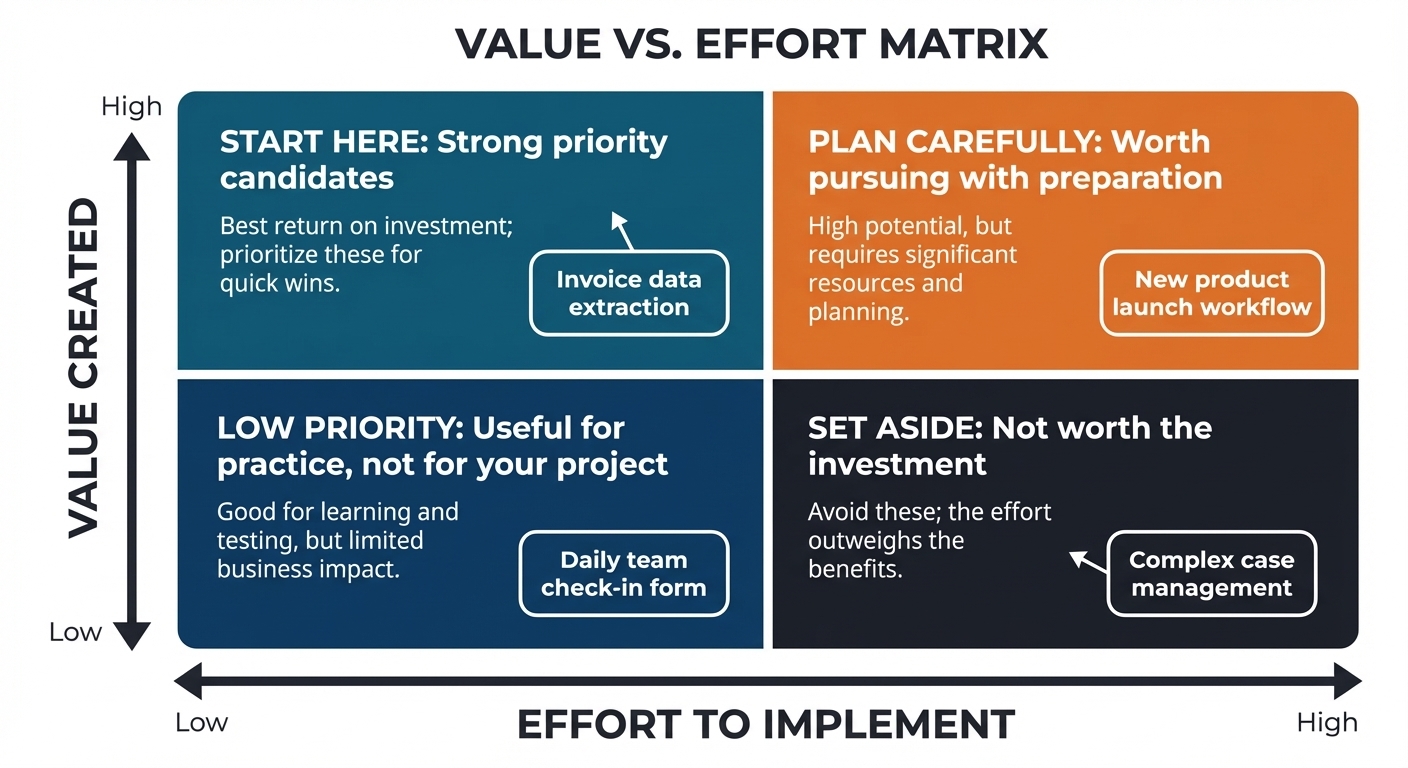
Think of the matrix as a first prioritisation step, not a financial verdict. It compares candidates quickly, using relative High/Medium/Low judgements, so you can commit to the right one. The detailed financial appraisal of the option you choose — a full cost breakdown and a rigorous return model — comes in Module 2, once you know what you are actually building.
The matrix is a communication tool as much as an analytical one. When you present your business case to your skills consultant at the gateway, being able to show that you considered multiple candidates and made a reasoned comparative judgement — rather than simply advocating for the first process you thought of — demonstrates exactly the kind of independent analytical thinking the apprenticeship standard requires.
For the distinction-level criterion, your business case should show the matrix with at least two candidates positioned, plus a paragraph on what the positioning reveals and why it supports your selection.
From value to return: calculating a rough ROI
A value estimate tells you what an opportunity is worth. It does not, on its own, tell you whether it is worth doing — for that you weigh the value against what it will take to get there. That comparison is the return on investment, and you can calculate a rough version of it right now, using the value estimate you have just built.
🔑 Return on investment (ROI): the net value an initiative returns, set against what it costs, expressed as a percentage. ROI = (Net Benefits ÷ Total Costs) × 100, where Net Benefits = Total Benefits − Total Costs. A related figure is the payback period — how long the value takes to cover the up-front cost: Payback = up-front cost ÷ annual net benefit.
Your value estimate gives you the benefit side. To calculate a return you also need a rough cost side. You have not chosen a platform or designed the solution in detail yet — that comes later — so a precise budget is neither possible nor expected. What you can estimate is the order of magnitude: roughly how many hours it would take you to build a working pilot (your effort, costed at an hourly rate), and any licence or subscription fee to keep the tool running. That is enough to calculate a first return.
Return to the invoice example. The value estimate released roughly £7,400 of capacity per year. Suppose a working pilot takes around 40 hours of your time to build — £1,000 of effort at £25 per hour — plus an extraction tool at about £25 a month, or £300 a year. Now you can put numbers to the return:
| First year | Amount |
|---|---|
| Value released (benefit) | £7,400 |
| Build cost (one-off, 40 hrs × £25) | £1,000 |
| Running cost (tool, £25/mo × 12) | £300 |
| Net benefit (£7,400 − £1,300) | £6,100 |
| First-year ROI = (£6,100 ÷ £1,300) × 100 | ≈ 470% |
| Payback = £1,000 ÷ £7,100 net per year | ≈ 7 weeks |
A return that large is normal for cheap no-code automation applied to high-volume manual work — which is exactly why these opportunities are worth finding. But notice what the figure rests on. The £7,400 is capacity released, not cash in the bank: it only becomes real return if that time is genuinely redeployed to valuable work. So test the assumption. If only half the released capacity is actually redeployed, the benefit falls to £3,700, the first-year ROI drops to roughly 185%, and the payback stretches to about three and a half months — still clearly positive, but a more honest figure to defend. Always state which assumption your return rests on.
This is a first, directional calculation, not a financial model. In Module 2 you will build a proper whole-life budget for your chosen solution — one that includes the running costs automation quietly accumulates, such as monitoring, maintenance, and review — and apply this same ROI formula to it, stress-tested across conservative, base, and optimistic scenarios. For now, calculating a rough ROI and payback does one job well: it turns "this feels worthwhile" into a number you can put in front of a sceptical stakeholder, and it stops you spending your apprenticeship project on an opportunity whose value never justified the effort.
Is it deliverable? A note on scope
Value and return tell you an opportunity is worth doing. One more question decides whether it is worth doing as your project: can you actually deliver it? The most common way apprenticeship projects come unstuck is not weak analysis — it is scope. The instinct is to choose something significant: a process that spans several teams, or tackles a longstanding organisational frustration. That ambition is understandable, and it is also how projects stall — the scope was too large to build within the programme timeline, or the organisational change required was too big to happen alongside a learning programme.
A well-scoped, modest opportunity that actually gets built — that runs, produces output, is used by real people, and can be evaluated — is worth far more than an ambitious proposal that never ships. The test for good scope is whether your opportunity is specific, bounded, achievable within six to eight weeks of build time, visible to the organisation, and supported by your line manager. If the answer to any of those is no, tighten the scope before you write your business case — often to a single step, a single document type, or a single team's version of the process. You can always scale a pilot that works; you cannot rescue one that was too big to finish.

📝 Activity 1 — Value estimation and prioritisation
Complete before your 1:1 session | Estimated time: 75 minutes
Using the Value Estimation Worksheet in your Module 1 Workbook (Unit 5 section), complete the following three tasks.
First, build your direct value estimate. Work through the four-stage calculation — time per instance, instances per week or month, annual time cost, reduction factor, hours released — stating every assumption explicitly. Then add a short paragraph (three to five sentences) on the indirect value: quality, consistency, staff or customer experience improvements the numbers don't capture. Finally, add indicative ranges for build and integration, ongoing operation and maintenance, and change or hidden costs. Compare their likely scale with the benefits, then name the assumption most likely to change your judgement. Do not calculate ROI, NPV, BCR, or payback here; Module 2 teaches those appraisal methods in depth.
Second, plot your Effort/Value matrix. If you scored more than one candidate in Unit 3, position each and write a paragraph (four to six sentences) on what the positioning reveals and why it supports your selection. With only one candidate, position it and explain how it scored on both axes, using your Unit 3 suitability dimensions as evidence for the effort estimate.
Third, calculate a rough return and run a scope test for your selected opportunity. For the return, estimate an order-of-magnitude cost (your build hours costed at an hourly rate, plus any running cost), then calculate the first-year ROI and the payback period using the two formulas from this lesson. Note the main assumption your figure rests on — usually how much of the released capacity is genuinely redeployed — and recalculate the return assuming only half of it is. For the scope, apply the five-part test (specific, bounded, achievable in six to eight weeks, visible, line-manager supported) and note in two to three sentences any adjustment you would make to keep the project deliverable.
Distinction-level criterion: Your Effort/Value matrix must include at least two candidates with written comparative analysis. A business case that shows you chose the best option from a considered shortlist is substantially stronger than one that advocates for a single candidate without comparison.
Bring your completed worksheet to your 1:1 session. Your consultant will use it to check the robustness of your value and return reasoning before you write the full business case.
⏭️ Up next — Lesson 2: With your value quantified, your priority process selected, and a rough sense of whether the return justifies the effort, Lesson 2 brings it all together into the five-component business case — and prepares you to defend it at the gateway.